1
2
3
4
5
6
7
8
9
10
11
12
13
14
15
16
17
18
19
20
21
22
23
24
25
26
27
28
29
30
31
32
33
34
35
36
37
38
39
40
41
42
43
44
45
46
47
48
49
50
51
52
53
54
55
56
57
58
59
60
61
62
63
64
65
66
67
68
69
70
71
72
73
74
75
76
77
78
79
80
81
82
83
84
85
86
87
88
89
90
91
92
93
94
95
96
97
98
99
100
101
102
103
104
105
|
WIDTH = 10000;
HEIGHT = 10000;
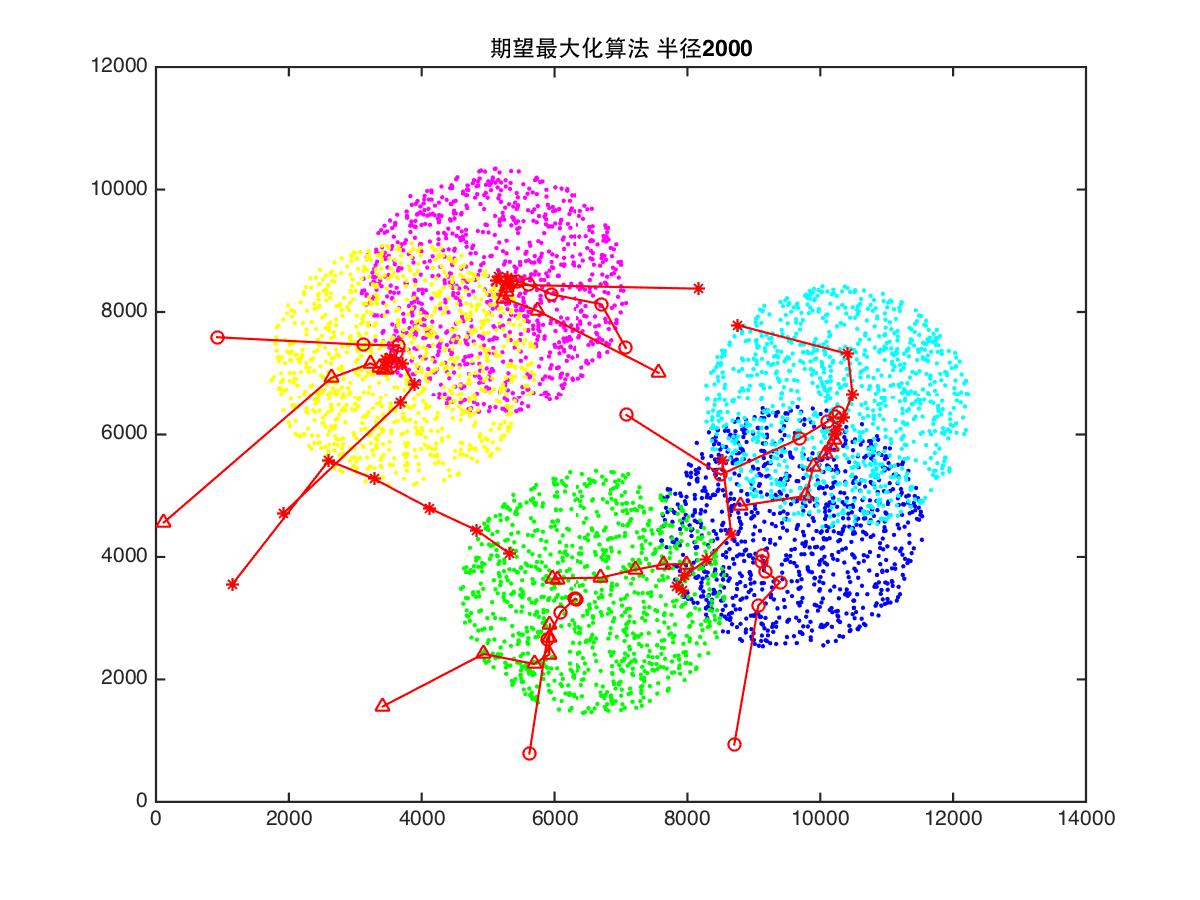
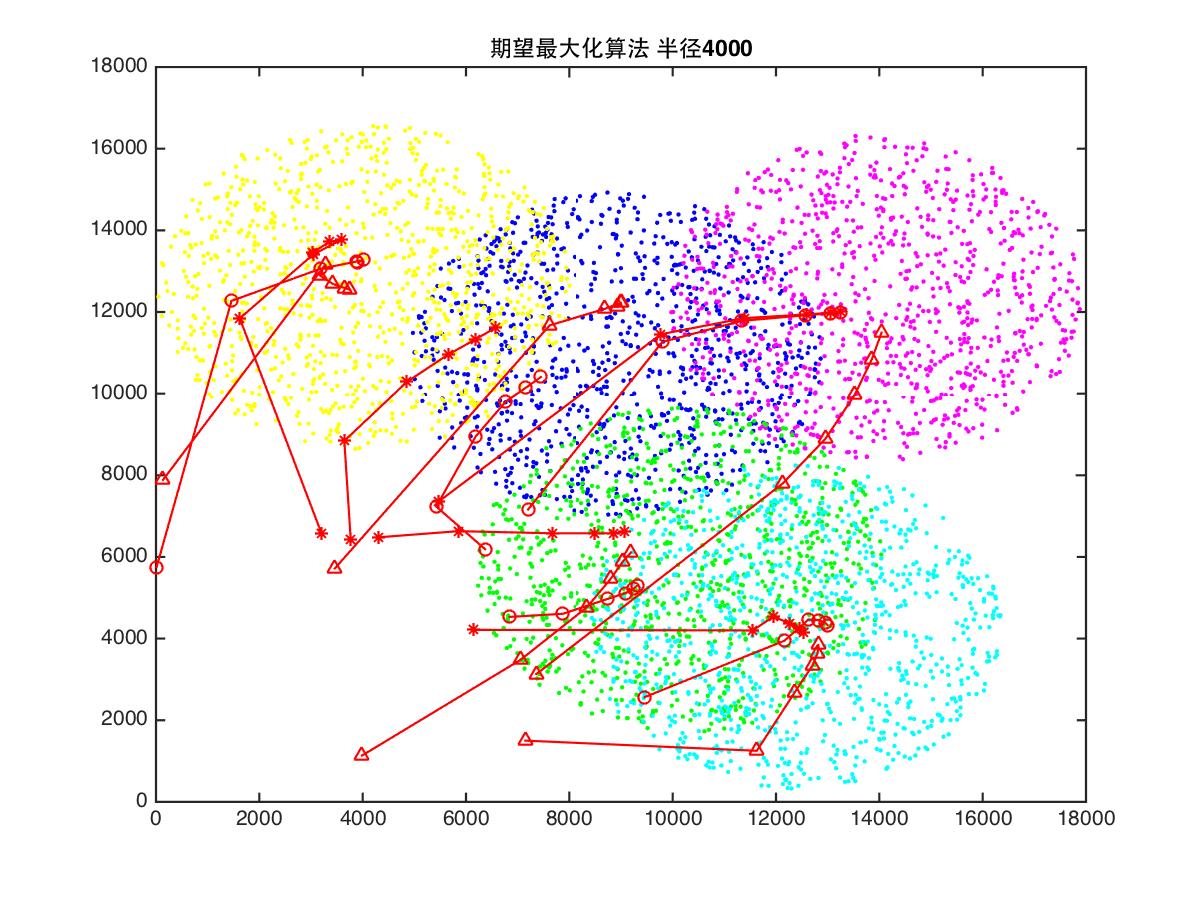
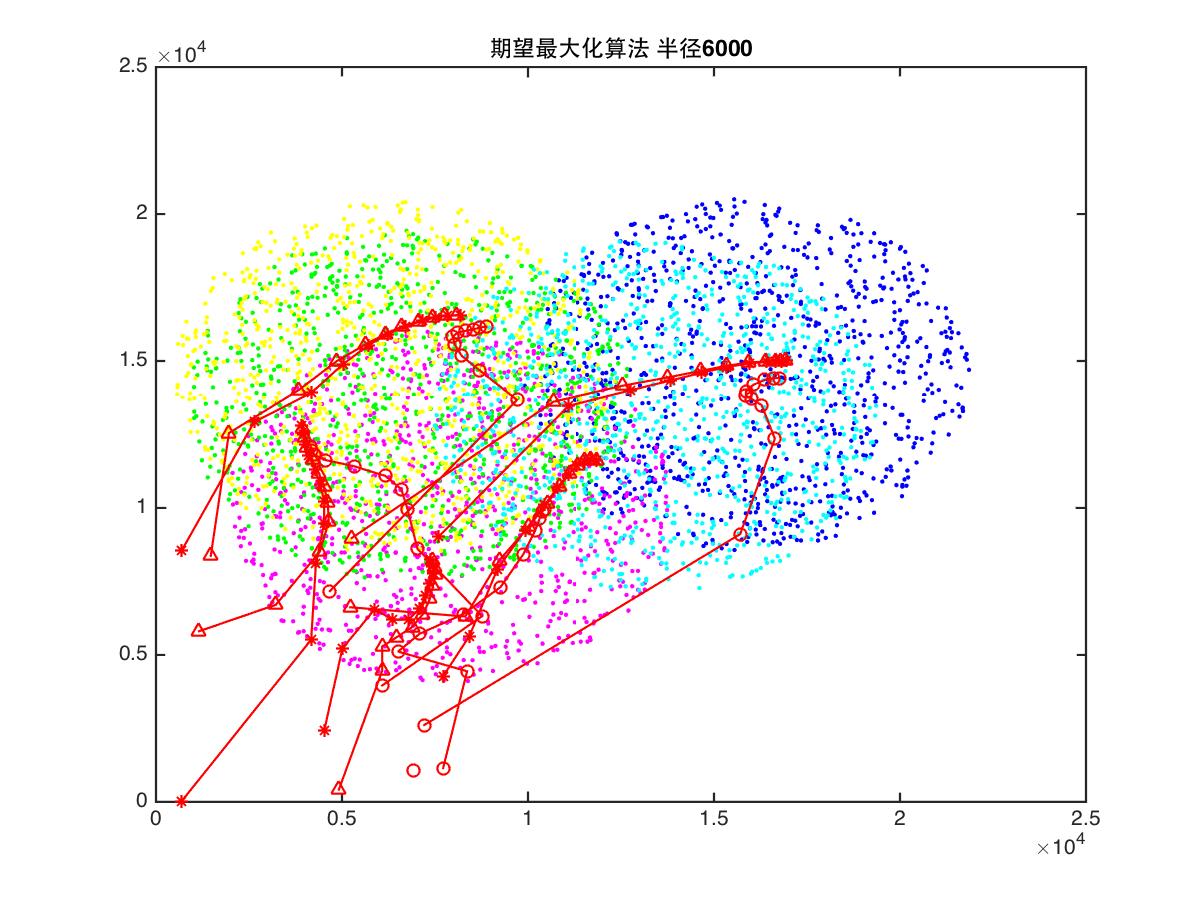
RADIUS = 6000;
ITERATE_COUNT = 10;
center_points = [];
all_points = [];
color = ['b', 'm', 'g', 'y', 'c'];
path = ['*', 'o', '^'];
for i = 1:5
center_point = [randi(WIDTH) + RADIUS, randi(HEIGHT) + RADIUS];
center_points(i, :) = center_point;
for j = 1:1000
while (true)
point = [randi(WIDTH + RADIUS * 2), randi(HEIGHT + RADIUS * 2)];
if (sqrt((point(1) - center_point(1))^2 + (point(2) - center_point(2))^2) <= RADIUS)
if (length(all_points) == 0)
all_points(1, :) = point;
break;
end
all_points(length(all_points(:,1)) + 1, :) = point;
break;
end
end
plot(point(1), point(2), [color(i), '.']);
hold on;
end
end
for m = 1:3
res = [];
for i = 1:5
point = [randi(WIDTH), randi(HEIGHT)];
res(1, i, :) = point;
end
distance = [];
for i = 1:ITERATE_COUNT
s = size(res);
cur_center = res(s(1), :, :);
for j = 1:length(all_points);
for k = 1: s(2);
point_1 = all_points(j, :);
point_2 = [cur_center(1, k, 1), cur_center(1, k, 2)];
distance(j, k) = sqrt((point_1(1) - point_2(1))^2 + (point_1(2) - point_2(2))^2);
end
end
assign = zeros(length(distance), 1);
for j = 1:s(2)
temp = distance(:, j);
smallest = sort(temp);
smallest = smallest(1:10);
for l=1:length(smallest)
for k = 1:length(temp)
if (smallest(l) == temp(k))
assign(k) = j;
end
end
end
end
for j = 1:length(distance)
if (assign(j) ~= 0)
continue;
end
[value, index] = min(distance(j, :));
assign(j) = index;
end
temp2 = zeros(s(2), 3);
for j = 1:length(assign)
temp2(assign(j), 3) = temp2(assign(j), 3) + 1;
temp2(assign(j), 1) = temp2(assign(j), 1) + all_points(j, 1);
temp2(assign(j), 2) = temp2(assign(j), 2) + all_points(j, 2);
end
for j = 1:s(2)
res(s(1) + 1, j, :) = [temp2(j, 1) / temp2(j, 3), temp2(j, 2) / temp2(j, 3)];
end
end
s = size(res);
for i = 1:s(2)
x = res(1:s(1), i, 1);
y = res(1:s(1), i, 2);
plot(x, y, ['r', path(m), '-']);
hold on;
end
end
title(['期望最大化算法 半径', num2str(RADIUS)]);
saveas(gcf, ['em_', num2str(RADIUS), '.jpg'])
hold off;
|